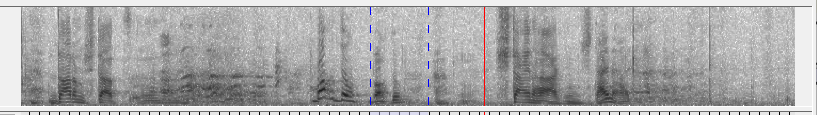
The Spectrogram Viewer displays a spectrum of frequencies of an audio file
(*.wav) or of the audio track of a video file. The horizontal
axis represents time (though the viewer currently does not show a time ruler), the
vertical axis frequency and color intensity represents the amplitude of a particular
frequency range at a particular time.
For the creation of the spectrogram the data of the audio signal have to be transformed to a spectrum of frequencies. The transform applied in ELAN is a Fourier transform (a fast Fourier transform, FFT). The transform is applied successively to small segments of the audio signal ("sliding windows") and creates an array of frequency bins (each frequency bin representing a range of frequencies) for each segment. To reduce the effects of discontinuity resulting from this segmentation, a window function (see the window function options) can be applied to the segments before the transformation.
The viewer shows the usual red vertical bar, the crosshair, to indicate the current point in time. It also marks the boundaries of the selected time interval, currently by means of blue vertical lines (instead of a light blue overlay on the image).
![[Note]](images/note.png) | Note |
|---|---|
Generation of the spectrogram image requires a considerable amount of processing, therefore it might be useful to switch off this viewer (see Section 1.5.21) if it doesn't serve your purposes (this is true for other viewers as well). |
The viewer provides a few options to customize the appearance of the image. The
context menu that is shown with a right click on the viewer contains the following
items:
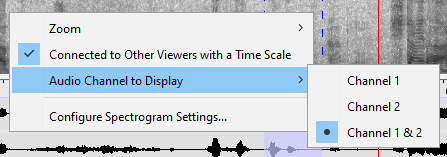
the menu allows to zoom in or out like in other viewers with a timeline
the option determines whether or not the visible interval remains in sync with e.g. the Waveform and the Timeline viewers
the menu items allow to select the channel(s) to display. Currently only files with a maximum of two channels are supported and in most cases using both is a good option (although it requires slightly more data processing).
the menu creates a dialog in which parameters that control the processing and visualization of the audio data can be configured.
| Note |
|---|---|
At the moment the settings are global (application wide) settings, but already open windows are not updated immediately when settings are changed. |
The audio contains two panels, one dedicated to visualization parameters and one to data transformation parameters.
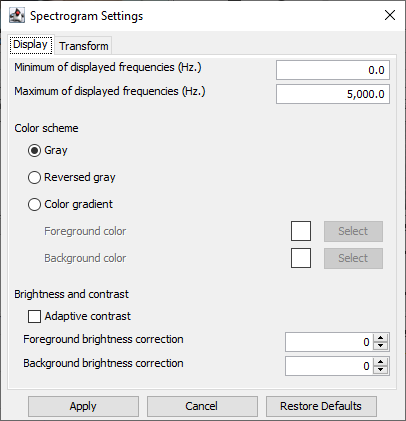
The following parameters determine the visualization of the spectrogram:
The range of can be set by entering the minimum and maximum in two textfields. The minimum value is displayed at the bottom of the image, the maximum at the top.
The default color scheme () for the spectrogram image is grayscale with higher color intensities (darker parts) corresponding to higher amplitudes. The option makes a grayscale image with the lighter parts corresponding to higher amplitudes. The option produces a color image for which a foreground color (higher amplitudes) and a background color can be specified. (The resulting image can contain more than two colors; the specified colors are taken as two points in HSV color space with possibly multiple colors in between.)
The brightness and contrast of the image can be adjusted in two ways.
When the checkbox is selected, the intensity of the color adapts to the actual values in the current visible interval. The highest amplitude value is black, the lowest white (in the default color scheme). As a result, when scrolling to the left or right, the darkness of that part of the image that was already in view, might change (because of the new data in the interval). For performance reasons this setting may be temporariliy ignored e.g. when the media player is playing. By default this option is not selected and the appearance of each section ("window" of the audio remains the same regardless of what else is in the visible area.
Otherwise (if the checkbox is not selected) the brightness and contrast of the image can be adjusted by specifying a correction for the foreground and/or background color, making them darker or lighter. The value entered for increases (negative value) or decreases (positive value) the intensity of the darker parts (in the default color scheme). The entered values are interpreted as percentages of the original range. Similarly the changes the lighter parts of the image (a positive value makes the lighter parts lighter).
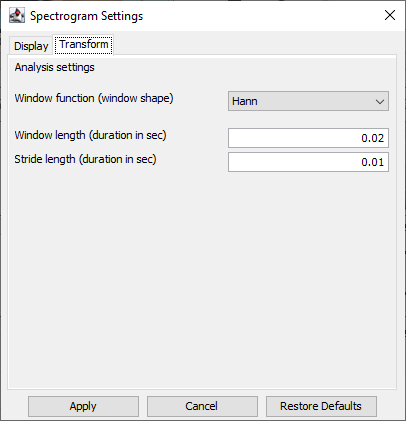
The following parameters determine how the data of the audio signal are transformed to a spectrum of frequencies:
The drop-down list provides a number of Window functions to choose from. The Rectangular (none) option means that no window function is applied.
The determines the duration of the segments that are passed to the transform function. The actual duration of the windows may differ slightly from the value entered here, because the number of audio samples passed to the function is adjusted to a power of two. A smaller window (shorter duration) leads to higher time resolution and lower frequency resolution (i.e. less frequency bins), a bigger window leads to lower time resolution and higher frequency resolution.
The determines the size of the step with which the sliding window is moved over the audio signal and therefore the amount of overlap between successive segments. The stride size can not be larger than the window size.
Apart from the and buttons, there is button which resets all settings to their default values (after clicking Apply).